Edit chart
Loading graph
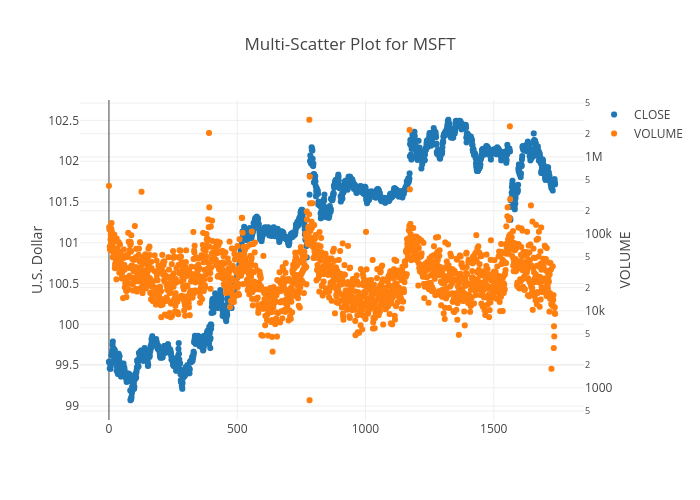
Makerportal's interactive graph and data of "Multi-Scatter Plot for MSFT" is a scatter chart, showing CLOSE vs VOLUME; with U.S. Dollar in the y-axis. The x-axis shows values from 0 to 0. The y-axis shows values from 0 to 0.